 he one question I get asked all the time is whether someone is getting Alzheimer's
disease. Sometimes they say it as a joke when they forget a name or a
word. But people are clearly worried about it.
The simple answer I always give is that unless someone in your family died of Alzheimer's disease before age 40, any memory loss before age 65 is almost certainly not Alzheimer's.
Estimating the risk is not easy, because Alzheimer's disease (AD) is a diagnosis of exclusion: your doctor must rule out B12 deficiency, vascular dementia, depression and other factors, all of which cause memory loss, then make a probabilistic judgment based on a cognitive test such as the Montreal test or the MMSE that prioritizes memory. A definitive diagnosis is currently only possible after death, and even though 79% of dementia is caused by AD, there are many other types of dementia besides AD that could strike at a younger age.
The CDC has a table showing the overall death rates. From this table it can be seen that your rate goes up exponentially with age and it is relatively rare for people younger than 75.
| Age Group | Death rate per 100,000 | Annual risk | Total risk* |
|---|---|---|---|
| 65–74 | 19.8 | 0.0198% | 0.198% |
| 75–84 | 184.5 | 0.184 % | 1.84 % |
| >85 | 987.1 | 0.987 % | 19.7 % |
However, these numbers may be somewhat misleading because death may occur ten years after the patient gets AD. What patients want to know is not the death rate, but the incidence rate. It is also misleading because genetic factors dramatically change the incidence. If a patient has a parent who died from early-onset AD, which is a genetic form of AD that strikes between 25 and 45, their risk could be 50%. Fortunately, although devastating to the families afflicted by it, early-onset AD is uncommon: only 5% of AD patients are in this group.
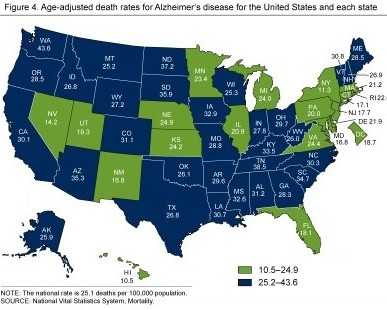
For late-onset AD, which is also called sporadic AD, the rate varies by sex (women have a 30% higher risk than men) and geographical location, as shown in this map of death rates in US states from the CDC. The rate in Hawaii is 10.5 per 100,000 while the rate in Washington State is 43.6 per 100,000.

CDC map of death rates from Alzheimer's disease by state
Apolipoprotein E
The strongest genetic risk factor for late-onset AD is ApoE. There are two common mutations, or polymorphisms, on the APOE gene, which means there are three forms of the ApoE protein, depending on whether position 112, 158, or neither are mutated (the case where both are mutated is very rare). So the common forms are ApoE ε2, ApoE ε3, and ApoE ε4 (called ApoE2 to ApoE4 for short). ApoE3 is the most common.
| ApoE1 | ApoE2 | ApoE3 | ApoE4 |
| 0.2% | 7.5% | 78.6% | 13.5% |
Many other variants, including ApoE1, ApoE5 and ApoE7, have been found. Some rare missense variants, including the R251G variant on ApoE4 and ApoEch (R136S, ApoE-Christchurch), are protective.
Each cell contains two interchangeable copies of the gene. This means there are six common genotypes: e2/e2, e2/e3, e2/e4, e3/e3, e3/e4, and e4/e4. Multiplying the frequencies of the alleles gives the percentage of each of the genotypes in the population. For example, approximately 61.8% (0.786×0.786) of patients are e3/e3 and 1.82% of patients are e4/e4.
| Position | 112 | 158 |
| ApoE2 | Cysteine | Cysteine |
| ApoE3 | Cysteine | Arginine |
| ApoE4 | Arginine | Arginine |
Because of this, the risk of late-onset AD is mostly genetic. A person with one ApoE4 allele has a 3-fold increased risk. A person with two ApoE4 alleles has a 12- to 15-fold increased risk. ApoE mutations account for about 20–25% of AD cases.[3] There are many other genes that increase the risk to a lesser extent, but their cumulative effect is such that it's been estimated that late-onset AD is 75% heritable.[1]
Risk predictions
A lot of effort has gone into stratifying the AD risk predictions. The primary tool researchers use is logistic regression, which is a way of fitting yes/no binary data to an S-shaped probability curve. This is similar to the Kaplan-Meier curve, where we plot the percentage surviving as a function of time.
About 1/4 of the heritability comes from ApoE, but it is estimated that there are between 40 and 100 other mutations, which we call SNPs (single-nucleotide polymorphisms, pronounced “snips”) that are statistically associated with late-onset AD. This is much lower than the huge number of SNPs associated with schizophrenia (184,879) and depression (172,735). For this reason, the authors in a recent Nat Commun article call AD “oligogenic.”[1]
The accuracy of these predictions is still far too low (on the order of 20% at best) to provide guidance to any individual. These marginal genes have functions in cellular repair and resistance to oxidants, so it's also a stretch to say they cause the disease, but they provide useful clues to scientists. Even the question of whether ApoE4 causes a loss of ApoE's repair function, or whether ApoE4 is inherently toxic, or both, is not yet known.

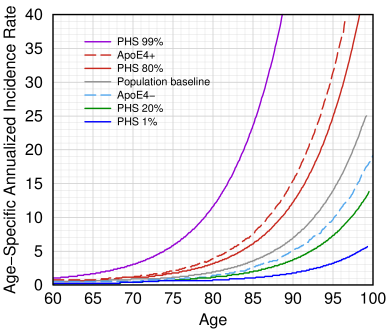
Alzheimer incidence rates by age for various genetic profiles. Redrawn from Desikan et al., Fig. 4.[2]. PHS score is a statistic derived from their genetic makeup that the authors say predicts the age at which they are likely to get Alzheimer's disease. The gray line shows the actual rates in the general US population, based on Brookmeyer's paper [4].
A good example of logistic regression can be found in a paper in PLOS Medicine [2] where the authors took data from 70,000 patients to calculate a polygenic hazard score to estimate age at onset for 6,409 AD patients and 9,386 aged controls. They created a graph, which is shown at right.
This graph tells us what we really want to know, and the gray line, which represents the average person, generally agrees with the public health estimates of Brookmeyer et al.[4] who said that a cognitively normal 60-year-old has a 0.08% chance of getting AD by that year, an average 65-year-old has a 0.17% chance, an 85-year-old has a 2.92% chance, while a 95-year-old has a 12.1% chance.[4] They estimated that the incidence rate increases exponentially, doubling every 4.9 years. Their calculation, still useful today, used the following equation:
Incidence (% per year) = 0.084 × e0.142(t−60)
where t = age in years. There is limited information for patients over 95, so the equation doesn't apply for them.
Brookmeyer is also the source for the commonly cited figure that 68% of individuals with AD are female. This is not just due to lower death rates by other causes; the reasons for it are not known.
The dashed red line in Desikan's graph shows that an ApoE4 carrier has a 35% risk by age 95, while a non-carrier has a 7% risk. By contrast, a person with a high polygenic hazard score, or PHS, as they define it, has a much earlier expected incidence of AD. This is why a reasonable goal is to delay AD if we can't cure it.

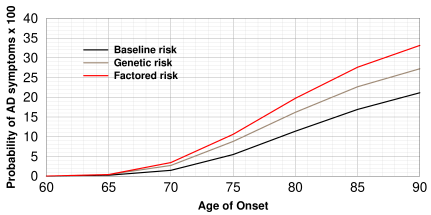
Alzheimer incidence rates by age estimated by Hane et al. using the Gompertz equation. (Redrawn from [8]). The black curve is the risk for the average person irrespective of ApoE4 genotype. Brown is the risk for "genetic risk" and red is "factored risk" where dietary factors are included.
Gompertz equation
Hane et al. [8] modeled AD age of onset for patients with
ApoE4-/-,ApoE4+/-, and ApoE4+/+ using the Gompertz equation. The Gompertz
equation is a probability curve of the form
![probability = a×exp(−exp[k×(age−age of onset)]) probability = a×exp(−exp[k×(age−age of onset)])](gompertz.png)
where A is the ultimate incidence (i.e. the plateau value of the
curve), k is a constant,
and xb is the average age of onset. It's typically used for
progressive diseases where the early stages develop in an exponential
fashion and then proceed linearly in later stages. The graph is shown at right.

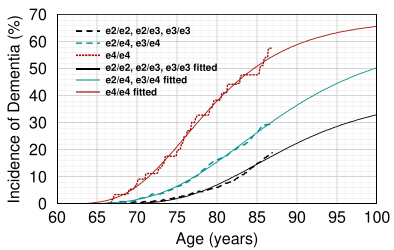
Dashed lines are measured cumulative dementia incidence rates by age obtained from the Framingham Heart study for different ApoE genotypes (Redrawn from [9]). Solid lines are Gompertz curves fitted to the data. The rates for e2/e2, e2/e3, and e3/e3 are not the same but were analyzed together. AD is uncommon in patients with an e2/e2 genotype. I have never seen anyone with e2/e2 who had AD.
A better approach is to draw a curve through the actual data, as in the graph at right. From the above discussion, it can be seen that estimates vary, mainly because no two papers measure the same thing. For instance, the Framingham study measured total dementia, not just AD (roughly 80% of dementia is thought to be AD). With a little brute force, it's more or less possible to fit a Gompertz curve to the data, but the parameters the computer gives you vary dramatically depending on the starting data.[10]
It should be emphasized again that these statistics are from research and could change dramatically as new information becomes known. No one should panic after discovering they have an ApoE4 gene. There is some evidence that stress and anxiety increase your risk [5–7]. This means if everyone got tested, it would screw up all these statistics, and the authors would have to do all those calculations all over again.
1. Zhang Q, Sidorenko J, Couvy-Duchesne B, Marioni RE, Wright MJ, Goate AM, Marcora E, Huang KL, Porter T, Laws SM; Australian Imaging Biomarkers and Lifestyle (AIBL) Study, Sachdev PS, Mather KA, Armstrong NJ, Thalamuthu A, Brodaty H, Yengo L, Yang J, Wray NR, McRae AF, Visscher PM. Risk prediction of late-onset Alzheimer's disease implies an oligogenic architecture. Nat Commun. 2020 Sep 23;11(1):4799. doi: 10.1038/s41467-020-18534-1. PMID: 32968074.
2. Desikan RS, Fan CC, Wang Y, Schork AJ, Cabral HJ, Cupples LA, Thompson WK, Besser L, Kukull WA, Holland D, Chen CH, Brewer JB, Karow DS, Kauppi K, Witoelar A, Karch CM, Bonham LW, Yokoyama JS, Rosen HJ, Miller BL, Dillon WP, Wilson DM, Hess CP, Pericak-Vance M, Haines JL, Farrer LA, Mayeux R, Hardy J, Goate AM, Hyman BT, Schellenberg GD, McEvoy LK, Andreassen OA, Dale AM (2017). Genetic assessment of age-associated Alzheimer disease risk: Development and validation of a polygenic hazard score. PLoS Med. Mar 21;14(3):e1002258. doi: 10.1371/journal.pmed.1002258. Erratum in: PLoS Med. 2017 Mar 28;14 (3):e1002289. PMID: 28323831; PMCID: PMC5360219.
3. Karch CM, Cruchaga C, Goate AM. Alzheimer's disease genetics: from the bench to the clinic. Neuron 2014; 83:11–26. doi: 10.1016/j.neuron.2014.05.041 PMID: 24991952
4. Brookmeyer R, Gray S, Kawas C. Projections of Alzheimer's disease in the United States and the public health impact of delaying disease onset. Am J Public Health. 1998; 88:1337–1342. PMID: 9736873
5. Stuart KE, Padgett C (2020). A Systematic Review of the Association Between Psychological Stress and Dementia Risk in Humans. J Alzheimers Dis. Sep 25. doi: 10.3233/JAD-191096.PMID: 33016901
6. Liew TM (2020). Subjective cognitive decline, anxiety symptoms, and the risk of mild cognitive impairment and dementia.Alzheimers Res Ther. Sep 11;12(1):107. doi: 10.1186/s13195-020-00673-8. PMID: 32917264 PMCID: PMC7488541
7. Santabárbara J, Lipnicki DM, Bueno-Notivol J, Olaya-Guzmán B, Villagrasa B, López-Antón R (2020). Updating the evidence for an association between anxiety and risk of Alzheimer's disease: A meta-analysis of prospective cohort studies. J Affect Disord. Feb 1;262:397–404. doi: 10.1016/j.jad.2019.11.065. PMID: 31744742
8. Hane F, Augusta C, Bai O. A hierarchical Bayesian model to predict APOE4 genotype and the age of Alzheimer's disease onset. PLoS One. 2018 Jul 12;13(7):e0200263. doi: 10.1371/journal.pone.0200263. PMID: 30001420; PMCID: PMC6042730.
9. Qian J, Wolters FJ, Beiser A, Haan M, Ikram MA, Karlawish J, Langbaum JB, Neuhaus JM, Reiman EM, Roberts JS, Seshadri S, Tariot PN, Woods BM, Betensky RA, Blacker D. APOE-related risk of mild cognitive impairment and dementia for prevention trials: An analysis of four cohorts. PLoS Med. 2017 Mar 21;14(3):e1002254. doi: 10.1371/journal.pmed.1002254. PMID: 28323826; PMCID: PMC5360223.
10. To avoid getting negative values for k, I changed the equation to p =A*exp(−exp(k*(age−xb))). For e2/e3, the parameters had to be estimated by trial and error instead of nonlinear least squares, as the computer kept insisting that a straight exponential was the best fit. Here are the params I used in the graph:
| Genotype | A | k | xb |
|---|---|---|---|
| e3/e3 | 40.00 | 0.1100 | 85.00 |
| e3/e4 | 61.21 | 0.0975 | 83.23 |
| e4/e4 | 68.09 | 0.1391 | 76.11 |
These numbers are quite different from those estimated by Hane et al.[8], who predicted values of A of 22.5, 49.6, and 93.8 for ApoE4−/−, E4+/−, and E4+/+ respectively. The latter number is the one that patients with e4/e4 are most concerned about; 68% vs 94% would be a big difference to these patients.
* Amino acid position is shown for mature ApoE. Some sources number according to the precursor protein, which has an 18 amino acid signal peptide on the N-terminal. This would change 112 to 130 and 158 to 176.
oct 07 2020, 7:41 am. updated nov 22, 2022 6:11 am. curve fitting added nov 24 2022, 4:55 am
